
For decades, professional money managers have used benchmarks for measuring performance. For stocks, the standard index has been the Standard & Poors 500 Index (S&P 500). However, this index has become so extremely concentrated that it is no longer representative of stocks as a broad asset class. So, effective immediately, I am replacing it as a relative performance benchmark for stocks with the S&P 500 equally weighted index.
It is prudent to measure performance and this is no less true for managers of investments. I use what is known as an absolute benchmark and a relative benchmark. The absolute benchmark varies by client but is a fixed percentage like 7%. This is our long-term goal and I measure net of fees and expenses in the accounts.
However, it is also good to have a relative benchmark because I can only invest in what is available and when it comes to stocks, there are no fixed returns. Their value varies continuously as markets set prices as long as the market is open, usually 9:30 am to 4:00 pm EST for stocks traded in the United States. To represent the return of stocks over any given period I need something to use as a benchmark. It must be representative of stocks and readily available.
 Back in the late 1800s Charles Dow came up with the idea of jotting down the daily closing price of 30 stocks and adding those prices together to come up with a stock performance benchmark. It became known later as the Dow Jones Industrial Average as is widely quoted in the news. However, the basic design is flawed in that the influence in the index each stock has is represented by its price. So a $100 stock has ten times the influence of a $10 stock and that is as arbitrary as it is simple.
Later, it was thought that 500 stocks would be more representative and that weighting them by their market capitalization would be the best method. Market cap is simply shares issued times the price of the shares. The thinking was that bigger companies would be more widely owned and ought to have more weight. This does make some sense but it also has a widely recognized flaw. Because of the weightings, it essentially only represents large companies. The top 100 stocks make up the vast majority of the weighting and thus the performance.
The second flaw is that by multiplying shares outstanding by price, we are back at Charles Dow’s problem of price being a large factor. This has always exaggerated the performance of the index by giving the most weight to those stocks performing the best by increasing in price. This can be good in the short term for an investor in products based on the index but bad for someone wanting an objective measure.
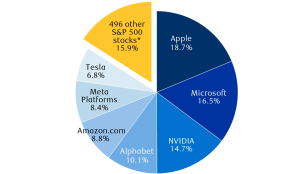 In recent years, this problem has become acute to the point of being ridiculous. As of June 2023 the top seven stocks provided 87% of the year to date performance of the 500 stock index. The index has gotten to where it is basically a seven stock index, even more concentrated that the 30 stocks in the Dow Jones Industrial Index. Worse, all seven are in the same broad industry, which is technology.
This has been a problem for many years, but in the last 10 years has become ever more extreme to the point that I cannot say with a straight face that the S&P 500 is an index representative of stocks as an asset class.
So, effective immediately, the S&P 500 index will be replaced with . . . the S&P 500 index. What? Yes, the same broad scope but with all stocks equally weighted so that each stock of the 500 has equal influence. It still obviously favors larger stocks but I will use the S&P 600 for midsize and small stocks. The S&P 600 is not the largest 600 stocks, it is the largest 600 after the 500 biggest. Alternatively, I can use the Russell 2000 which I have used for many years.
Now, nearly all accounts are accounts with some other assets like bonds or money market or limited partnerships of various stripes. So the relative benchmark for an account as a whole will be an ETF from inSights that is weighted between stocks and bonds in a mix similar to that of the account.
In managing 401(k) accounts, models will be measured against balanced funds in their peer group, i.e., funds with a similar mix of stocks to bonds.
1https://www.rbcwealthmanagement.com/en-us/insights/reading-between-the-lines-of-the-stock-market-rally#:~:text=Big%207%20stocks%20represent%20a%20big%20chunk%20of%20S%26P%20500%20returns&text=The%20S%26P%20500’s%20YTD%20total,to%2084.1%25%20of%20the%20returns.